We’ve adopted an approach to build in the open, and we’ll use this forum to let you know where we’re headed.
Developers in our early access program have installed CodeSee to record their app and inspect their source code, runtime data, loops, nested functions, all in code execution order.
Based on feedback from early users, we’ve launched new features to help you “hone in” on the right function or variable in your recording.
Searching your data flow
Search the functions, variables, and even text from your comments within your recording. All results will show up, even if they’re deeply nested in the call stack.
We’ll continue to add more to search – one thing coming soon will be the ability to search your runtime data, not just the functions and expressions in your source code!
A clean, streamlined design
We’ve redesigned the data flow to remove clutter and help you focus on what’s most important. On the left side of the data flow is a new “timeline” element to make it clearer that the information is being displayed in execution order.
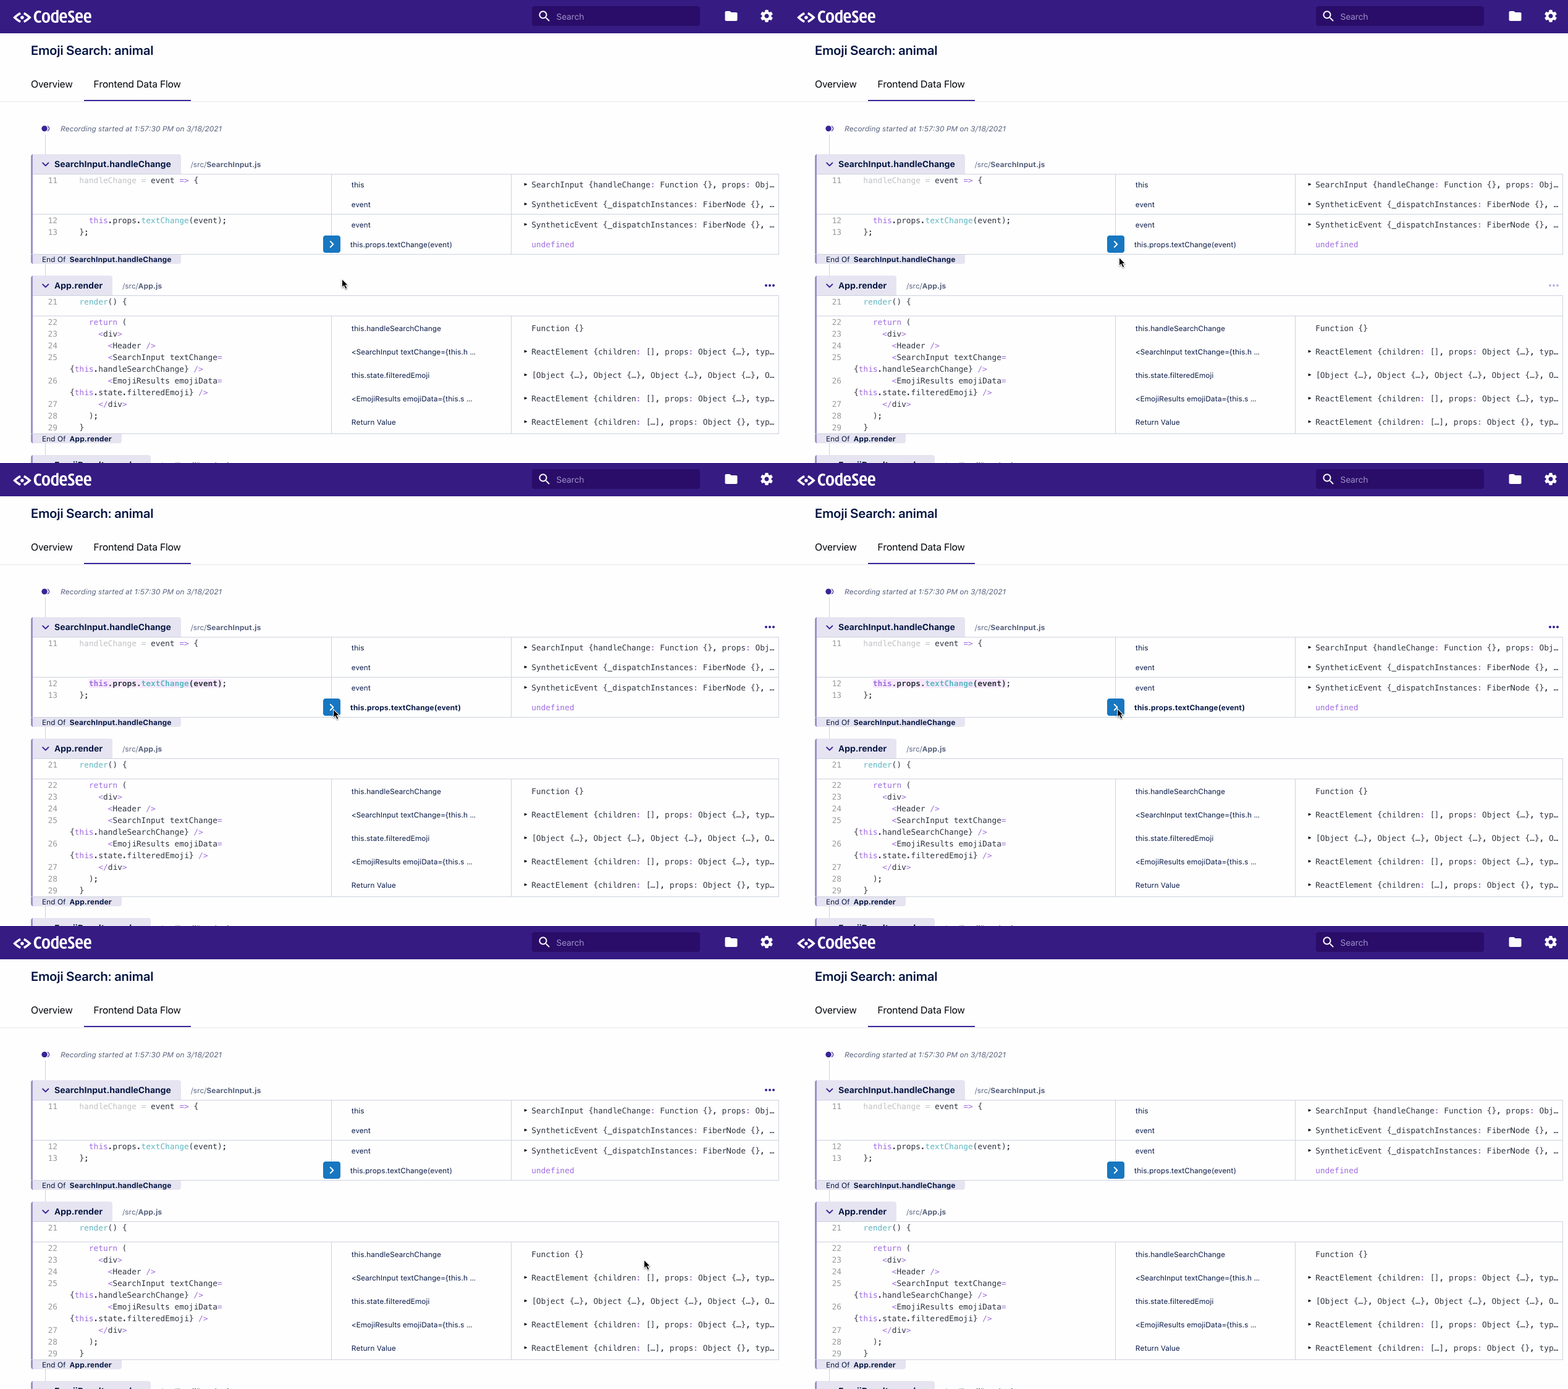
For more on the redesign, see the blog post: Redesigning our data flows, putting users first.
User events on the timeline
We’ve added user events to the timeline. Every time you interact with your app via the mouse or keyboard, you can see what operations were triggered. Use the arrows to jump quickly to the next user interaction in the recording.
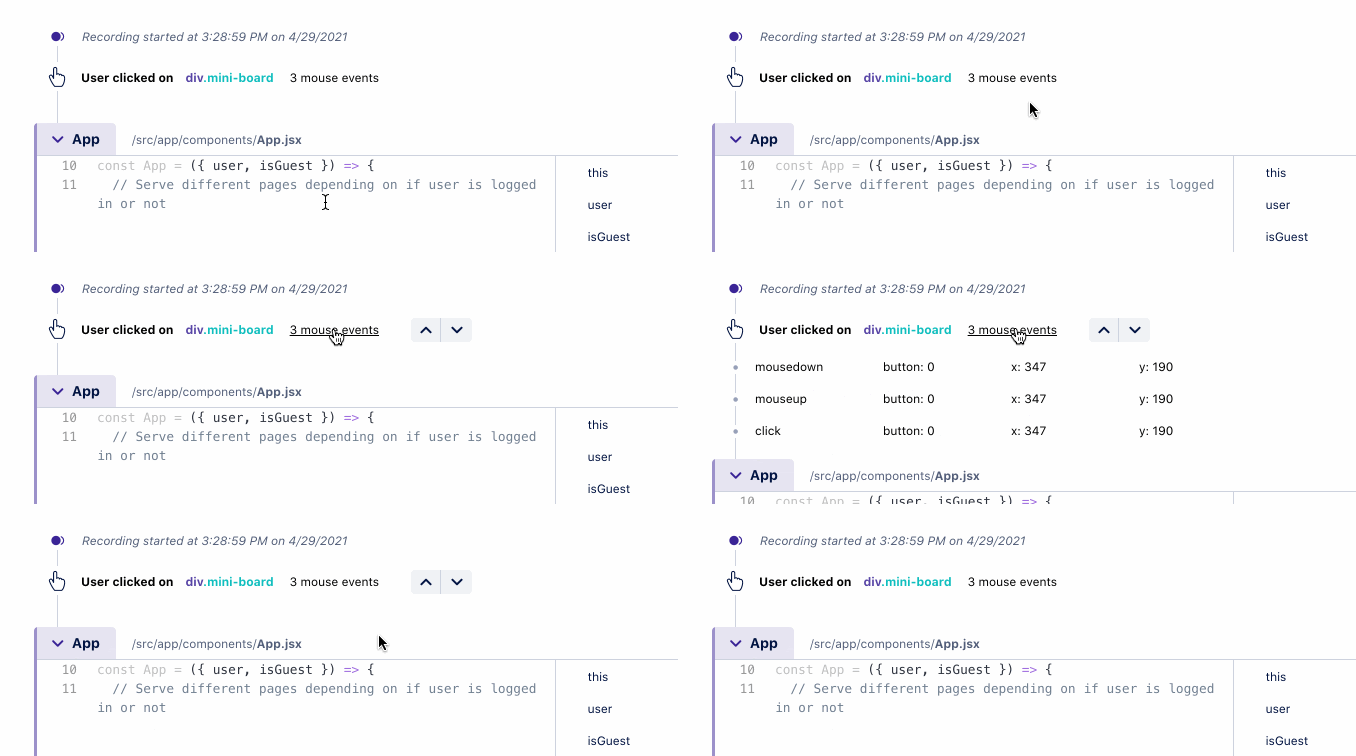
To start seeing user events on the timeline in your CodeSee recordings, install the latest CodeSee package, rebuild your project, and run.

