We know how long you spend trying to understand code, whether it’s a new part of the codebase, code you haven’t touched in a while, or just a flow in your app that seems to change with every PR.
Our mission at CodeSee is to help you develop continuous understanding of your code. With data flows, you can record an interaction with your application, then see the process of what happens during execution, including the code, data, logic, loops—unfurled in a visual, interactive map.
Early users have been finding data flows a powerful way to onboard to a codebase, debug a sticky problem, or share understanding with teammates. But we’ve heard from early users that they can be overwhelming, so we’ve been iterating on ways to let you pinpoint the parts of the flow that are most relevant to your task at hand.
We’ve launched 4 new features this week that will help you zero in on what you’re looking for in a data flow.
CodeSee.log()
Console logs and print statements can help you debug and understand our code, but they provide only a narrow window into your runtime environment. You often have to go back and add a second or third print statement to piece together your understanding of the flow.
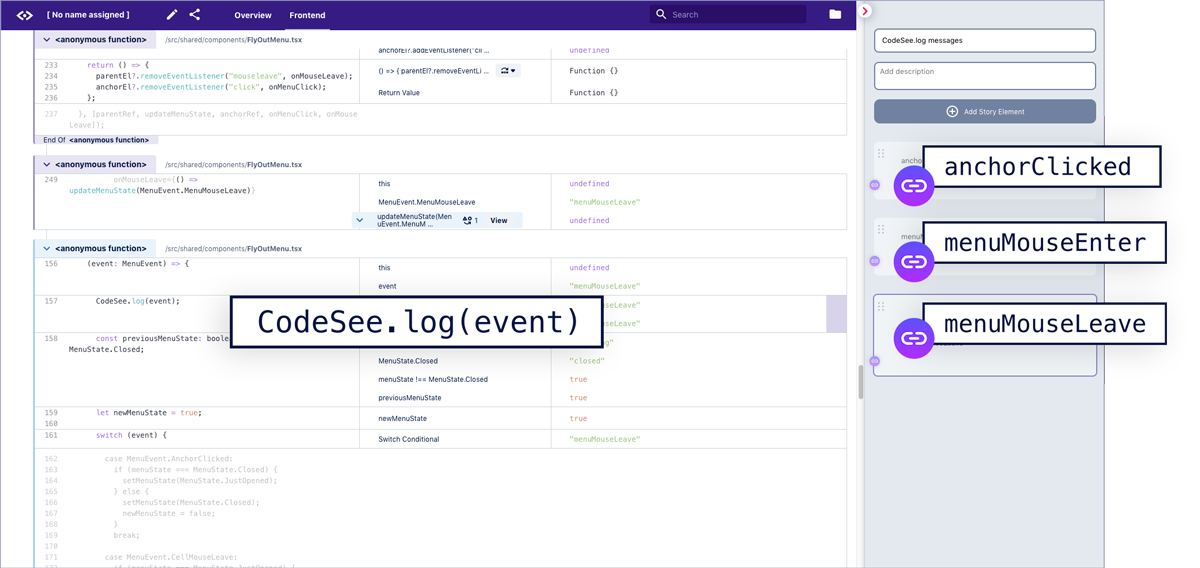
Starting this week, you can use CodeSee.log() in your code to capture this understanding in one shot. Add CodeSee.log() where you want more visibility, record your app, and your data flow will have links in the right side bar that jump you directly to where each CodeSee.log() occurred. It’s like having a print statement... everywhere!
Data search
Developer tools let you search function and variable names in your code, but often the thing you’re looking for isn’t a line of code but a particular piece of data that passed through it. With CodeSee you can search not only your code but also your runtime data: the value of every variable and expression.
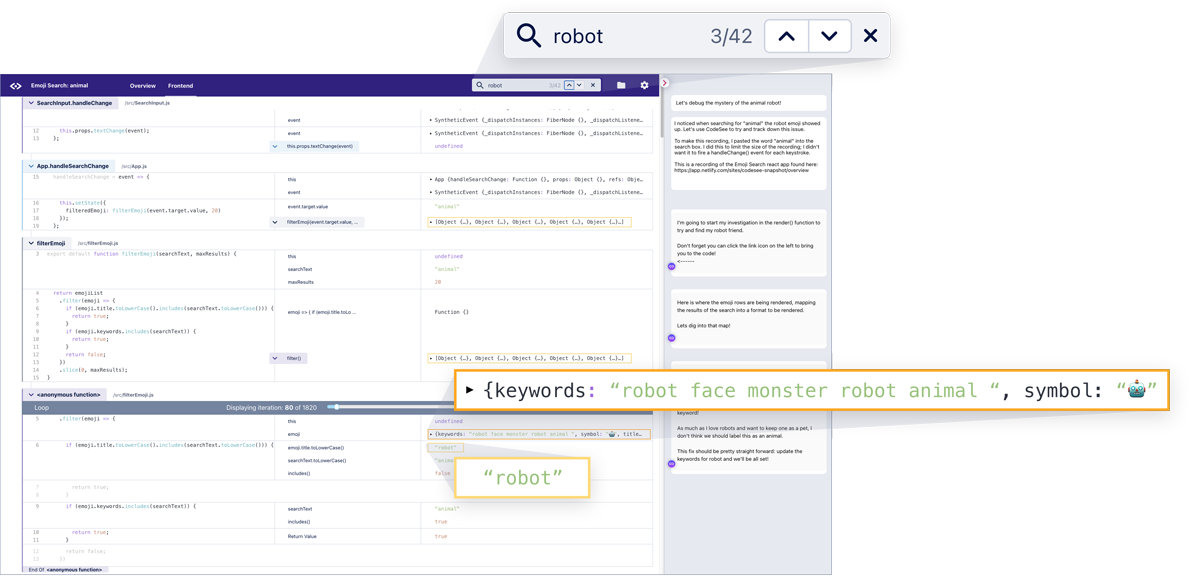
Use Search in the top bar of your data flow to easily find any data, whether it’s a buggy value, an error message, or a specific user’s ID.
React state changes
Most developers rely on React dev tools today to inspect React state changes, in a view that is completely divorced from your actual code.
At CodeSee, we believe there’s a lot of value in seeing this React state in context, and seeing how it changes. Now you can see each React state change (the value both before and after the change) directly next to your code in a data flow. You can examine not just the change but all of the code that led up to it.
When you see the state change icon, click on “View” to see React state change details in the side effects panel.
Callback go to execution
Understanding your code requires you to be able to follow the flow of execution from one function to the next and one file to the next. Often callback functions make this more challenging.
Now with CodeSee you can instantly continue the flow of execution from a callback to where it’s executed with the click of a button.
We’ve added a “go to execution” menu that appears next to callback functions in the middle column of your data flow. From that menu, you can jump to the points in the execution map where it was executed.
—
To start using CodeSee.log, React state changes, and callback go to execution in your CodeSee recordings, install the latest CodeSee package, rebuild your project, and run.
We hope these features help you pinpoint the code you’re looking for and develop your understanding of the code. Let us know how it goes! If you have ideas, feedback, or support questions for us, you can always reach us at: feedback@codesee.io.