There’s a concept called “lexical relativity.” The concept states that the language we use dictates our thoughts and our actions. Thus, when we constrain our language, we constrain our thoughts and our actions.
I think about this whenever someone says their job is to ‘write code.’ It’s not that this isn’t true–engineers do write code–but that describing what you do as just writing code is to undersell your role.
You're not just ‘writing code’–you are building a system.
This distinction is important. In fact, this distinction is not only important but also transformative in the way you perceive your role as a software engineer or a coder.
When you say you are 'writing code,' you are limiting your mindset to the lines of code that you put together. This mindset can keep you hyper-focused on the immediate tasks at hand (👍) but potentially miss the broader context and impact of your work (👎).
When you shift your perspective and consider yourself as someone who is 'building a system,' you are reframing your work as an integral part of something larger, more complex, and significantly more impactful. You’re not just crafting lines of code; you are constructing a system that will facilitate processes, solve problems, and drive innovation.
This is all great, but how do you do that? How do you move beyond your file and your function and your code to see the wider system?
Service Maps are a window into your systems
When you are stuck in the text interface of an IDE, tracing API calls and trying to understand the flow of your code and your system is like one of those choose your own adventure books.
“Want to follow the bear into the cave? Turn to page 6.”
“Want to find the definition of this auth call? Go to /api/auth/login.tsx”
You end up chasing the calls and the dependencies down the rabbit hole and through the files in your codebase. Suddenly you have 15 tabs open and can’t remember where you started.
Service Maps are the answer to this problem. Not only do they visualize your code like other CodeSee Maps, they also visualize how the system works together, the flow of information, data, and communication through that code.
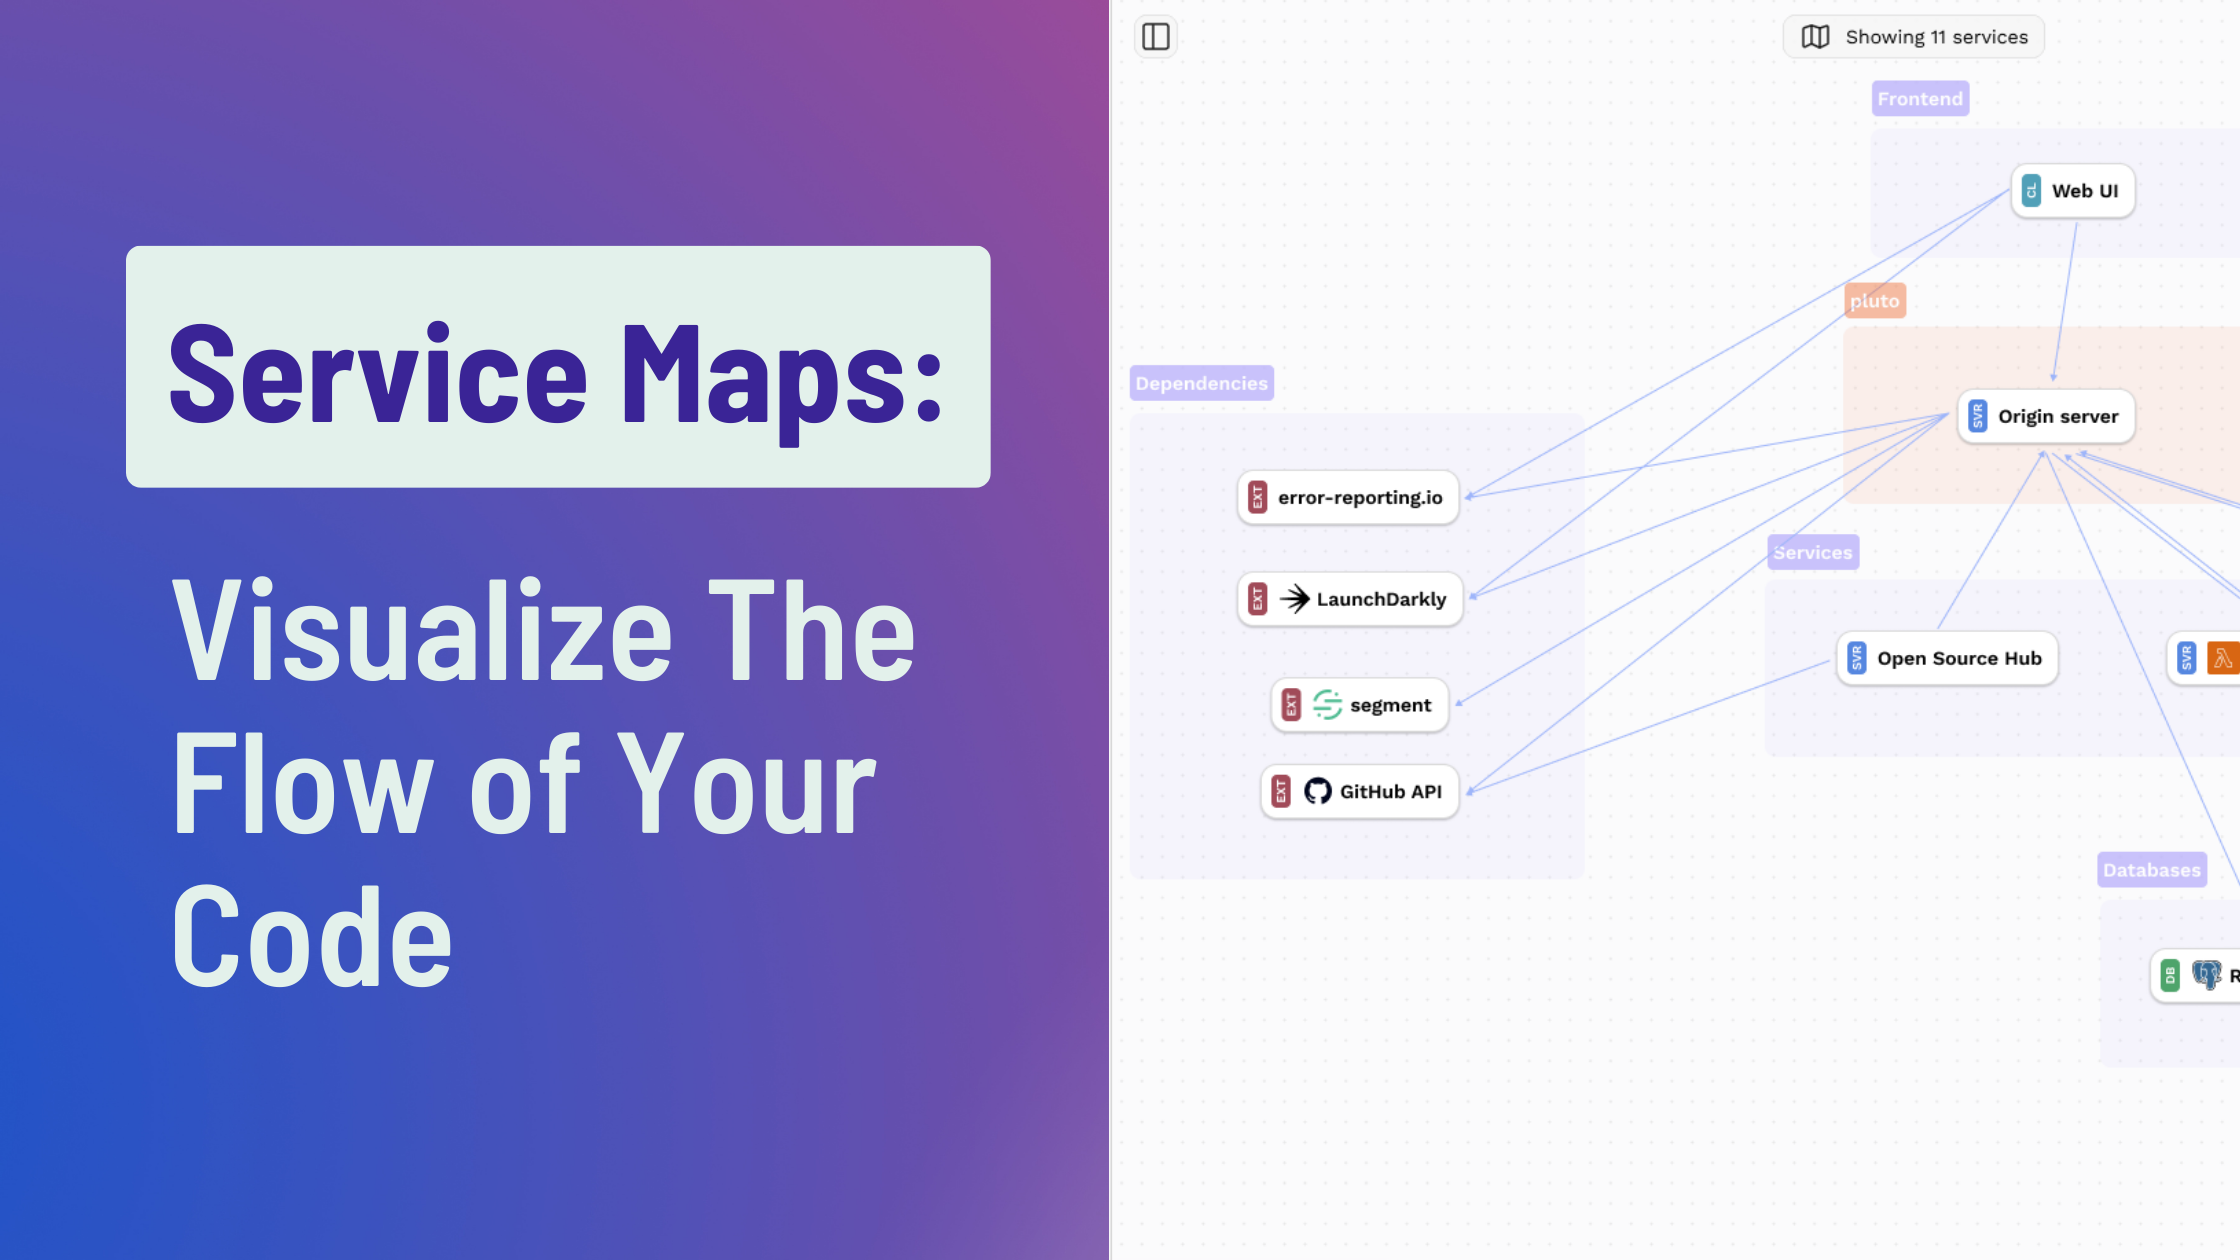
Here’s an example Service Map:

Even in a situation like this with 20+ services or calls, it is immediately understandable. The Service Map comprises two distinct types of nodes, interconnected by numerous connections:
- Service Nodes: These nodes represent the services within your system. In many cases, these services are instrumented through your tracing technology, providing explicit visibility into their interactions. However, there are also implicit nodes that may not be instrumented, such as databases or S3 buckets. CodeSee has the ability to infer the existence of these nodes and includes them as integral components of your system.
- External API and SaaS Nodes: Some nodes represent external APIs or SaaS products that your system interacts with. CodeSee detects the usage of these APIs and visualizes them as significant elements within your system. It recognizes that disruptions or downtime of these external dependencies can directly impact the functionality of your system.
The connections between nodes represent the communication pathways between them. Each connection illustrates the initiation of requests from the originating node (the base of the arrow) and their reception at the destination node (the head of the arrow). For instance, in the case of an HTTP request, the arrow originates from the referrer and points to the service that generates the response. This principle applies to various types of communication, including database queries and other API requests.
You no longer have to jump between files. By visually representing these nodes and connections, the Service Map offers a comprehensive understanding of the relationships and interactions within your system. It allows you to trace the flow of information, identify dependencies, and comprehend the impact of various components on the overall system's performance and stability.
There is more information here than just a pretty diagram, though. Clicking on a node brings up information pertaining to that service:

You get a link to the code and to the documentation for that service. You can also see the flow of data into this service:

There are 183 incoming calls, mostly from general sources and the web UI. We can also look at outgoing calls from a service:

Here we can see this RTCE server has 18 outgoing calls, mostly to Redis.
So instead of looking at the code manually and trying to infer the incoming/outgoing flows of information, a Service Map presents exactly what you need. This is how it is a window into your system. You can use it to see everything that is happening at a high-level, then drill down into the granular detail of individual API calls.
But you can go further–the connections between services don’t have to be just theoretical calls. Using Flows and integrating with Datadog or OpenTelemetry, you can see actual execution flows through your services. You can see:
- which database tables are being accessed
- which API calls are being made
- what message queues populated
- what lambdas are executed
So you have a living, breathing map of not just your system, but the function of your system. It’s like the traffic layer on Google maps, telling you where’s busy and where’s broken.
Let’s now look at two specific places Service Maps can help in your organization: onboarding and refactoring.
Service Maps for onboarding
Codebase maps are a great way to onboard new engineers. You can quickly and easily and contextually introduce them to the code they will be working on.
Service Maps can take that a step further. Once they have a good understanding of the codebase, they can then be introduced to how that code functions to create an entire system. This can help the new engineers in two ways:
- They ground the engineer in what the system is and how they interact with it. A frontend engineer might not have any idea of how data gets to their tables or information to their lists. They just call APIs. Service Maps give them an overview of the system to understand the data, the message queues, and the workings of those APIs they’re calling. With flows they can better see how the data is getting to their UI. All this information will help them build better applications.
- They ground the engineer in how what they do matters. If you are working on a small component of a huge system, sometimes it can be hard to see the wood for the trees. Service Maps show the entire forest. If a DevOps engineer is implementing some Lambda functions, they might not know where the data is coming from or where it’s going to. Flows can then help them see their lambdas being executed and the system working as designed, around their input.
Of course, onboarding isn’t just about new engineers. It happens whenever you have new code, or need to understand something new, or there are up or downstream changes. WIth each of these Service Maps can help your team understand how the system is adapting to the change.
Service Maps for refactoring
A nightmare scenario for any engineer is to make a small change to an endpoint, only for the entire service to go down. What you thought was some esoteric piece of code was actually underpinning your entire application. It is a nightmare, but one that most developers have probably lived through.
How can you do that better? How can you know what's going to be affected?
With Service Maps, all you need to do is pull up the service and find the endpoint:

You then get the information about that endpoint:
- Where the endpoint definition resides
- A list of all the consumers of that endpoint
In just a couple of minutes, you have a complete understanding of how the single endpoint interacts with the rest of the codebase. You can then plan your change, talk it over with the team responsible for the consumers, and push the code knowing what is going to be impacted.
Another example. You need to refactor everywhere on the origin server that uses the GitHub API.

Typically, this is extremely hard to do as you have no visibility into our services. You might know where you added the GitHub API, but what about the 20 other developers on your team? Or all the ones that have left?
With Service Maps, you select the service that you care about, look up the API calls and you can see how the GitHub API is being called. Now you can go through each of these calls (you can even get a CSV of the list so you can check them off as you go) and refactor as needed.
Functional visibility
You aren’t just writing code; you’re building a system. You might be the only one building that system, or one of 10,000 engineers doing so, but if you are employed to ‘write code,’ your code is an integral part of your application’s system.
It’s easy to forget that when you are deep in VS Code. Service Maps give you and your team the ability to get your head up and out of the code and into the system to see how it really works, and importantly how it sometimes doesn’t. By visualizing the flow of your code, you can take tasks that previously would have been laborious, such as refactoring planning, and turn them into two-minute jobs.
But most importantly, by seeing the system you can start to build better systems. The power of visualization, the ability to discern complex processes, enables you to go beyond being a coder to a builder of sustainable, efficient systems.
Ultimately, the embrace of Service Maps is not just a step towards a more intuitive workflow, but a leap towards an elevated understanding of the intricate connections within the code, promoting excellence in building more resilient and robust applications.