How I use CodeSee to take on large codebases with greater confidence (and better results).
I recently started using CodeSee to wrap my brain around large codebases, and I’m not going back. CodeSee provides a clear, simple way to understand the relationships between dependencies and utilities inside a codebase.
I used to map out user flows by hand—here’s a photo so you can see what I’m talking about:
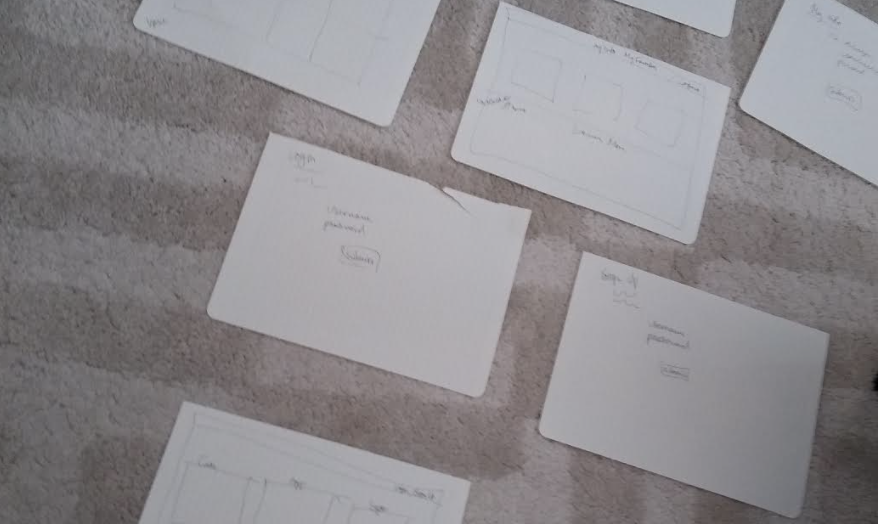
It was important to me to understand user flow by representing events, files, and dependencies with blocks and arrows. Edward Tufte, an American statistician and visual thinker, describes the concept of the “thinking eye,” explaining:
“Well, first, it's about how to see, intensely, this bright-eyed observing curiosity. And then what follows after that is reasoning about what one sees, and asking: What's going on here? And in that reasoning, intensely, it also involves skepticism about one's own understanding. The thinking eye must always ask: How do I know that? That's probably the most powerful question of all time. How do you know that (NPR.org)?”
Applying the thinking eye to a codebase means asking what you know, and how you know it. CodeSee can help you find the answers to these questions quickly with codebase mapping. To see what I mean, let’s dive into an example.
Generate a Map of your codebase
I’ve created a codebase using Create React App’s auto-generated npx command. To seasoned React developers, the structure of this codebase is intuitive; they’ve created a universal mental model over time by working with React apps in many different instances. For someone new to React, or perhaps new to the entire field of front-end development, the codebase might look complex. Adding a CodeSee Map can help reduce that complexity.
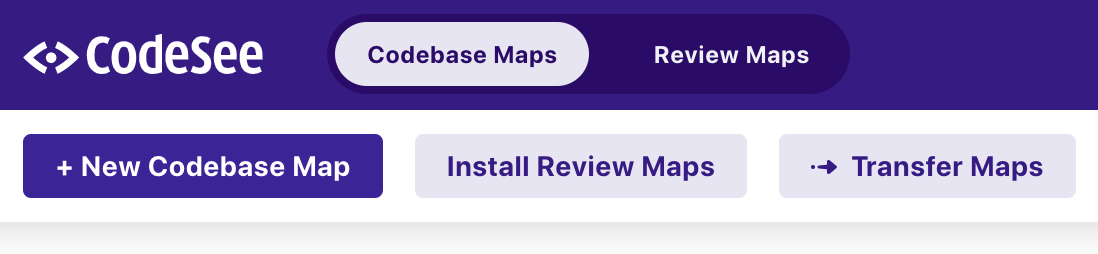
To add CodeSee to my repo, I login using my CodeSee account and click the ‘New Codebase Map’ button.
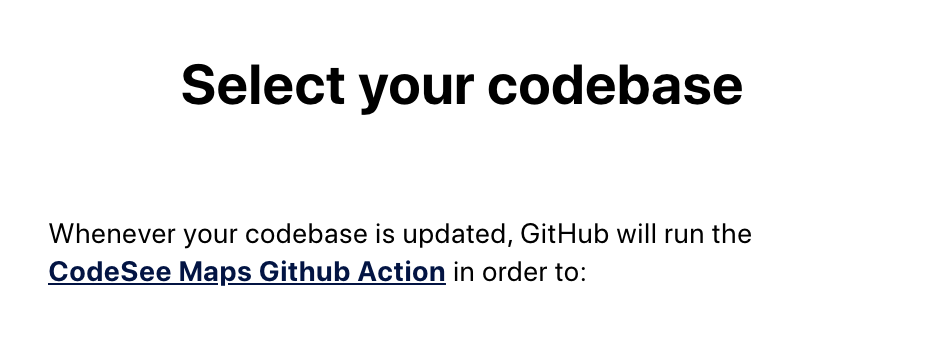
I then select the codebase that I’d like to map:
Next, I’m given a repository secret from CodeSee. I follow the instructions to add the secret to my GitHub repository, then I create my diagram. CodeSee operates via certain GitHub Actions, which rely on secrets to execute.
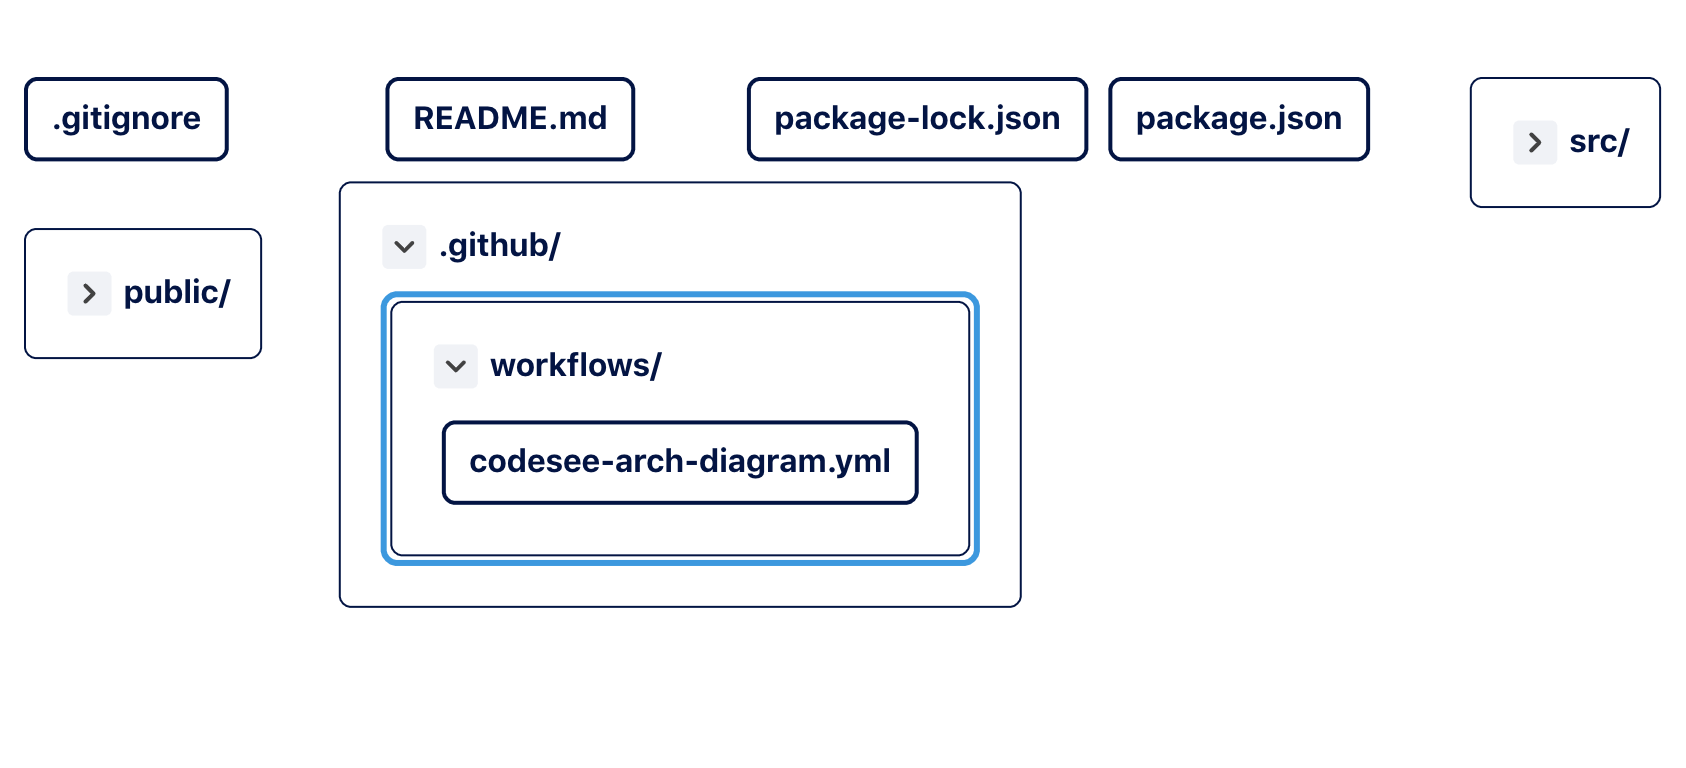
Once I click ‘Create Map’, it’s generated! You can use the Map to see the CodeSee workflow `codesee-arch-diagram.yml` inside the `.github` folder. That file contains the GitHub actions that determined how the Map got generated! Pretty meta, huh?
Of course, now we can get down to the business of understanding the general structure of a React application.
Use CodeSee to understand the structure of your codebase
When you’re getting familiar with a new codebase, there are questions you can ask yourself that will help you learn to use it better. There are four that I generally ask myself, and they all fall under the umbrella of, “What is the goal of this codebase, and how does it accomplish that goal?”
For example, for a React app made with Create React App, I’d say the general goal is to make a single page web app. It does this using a JavaScript framework to segment components and manage state.
Now, let’s say I’m unfamiliar with Create React App, and I’m in my first week or two in a new role. I’ve been assigned two tickets in a React application codebase. The first says, “Add testing for the homepage” and the other says “Add a link to our company Twitter profile to the homepage.” Let’s see how using CodeSee in conjunction with asking these four questions can help me move these tickets from the “To-Do” column to the “In Progress” column in the team project board.
1. Where does the main ‘work’ of the application get done?
The first thing I’ll want to do is look at the piece of code with the most interdependencies—it’s likely this piece of code dictates key utility functions or dependencies, or class instances, whatever they may be. In this example, I click around and see that `App.js` is a busy file.
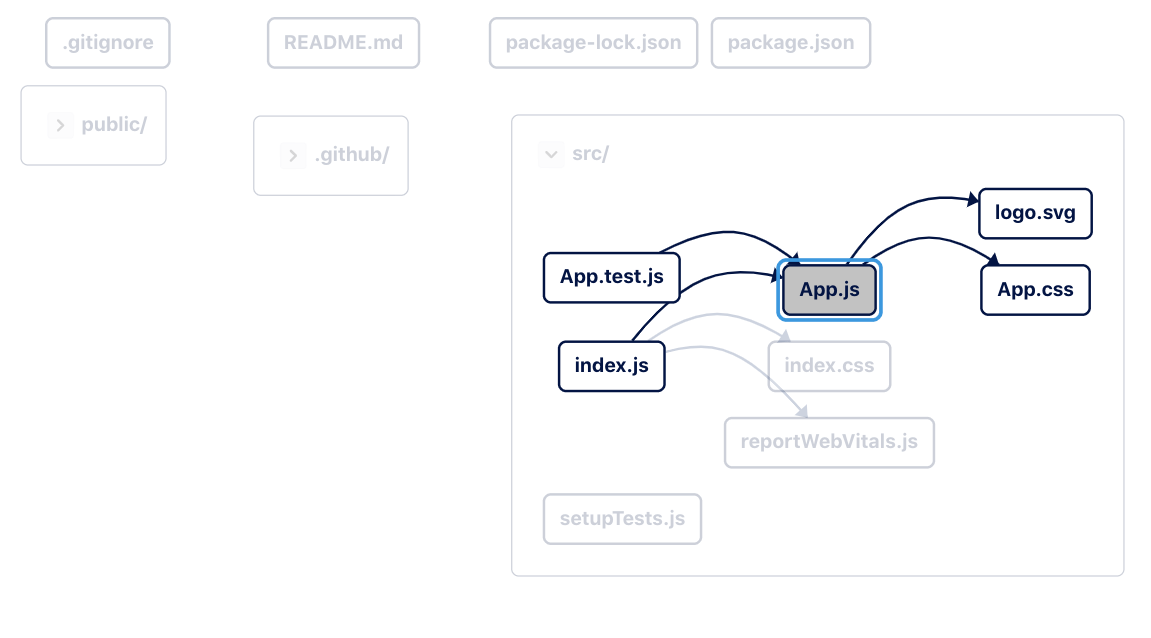
I can see `index.js` imports `App.js`. This is a key indicator, since `index.js` is a conventional name for the file that is usually loaded first in Node environments. This file is likely the core of the codebase. Looking at the code, I can see that `App.js` indeed declares and exports the main component for `index.js` to render in the browser:
import logo from './logo.svg';
import './App.css';

function App() {
  return (
    <div className="App">
      <header className="App-header">
        <img src={logo} className="App-logo" alt="logo" />
        <p>
          Edit <code>src/App.js</code> and save to reload.
        </p>
        <a
          className="App-link"
          href="https://reactjs.org"
          target="_blank"
          rel="noopener noreferrer"
        >
          Learn React
        </a>
      </header>
    </div>
  );
}

export default App;
The rest of the files test and style this main file, `App.js`, which brings me to answer to the next question:
2. What imports does this main piece of code rely on?
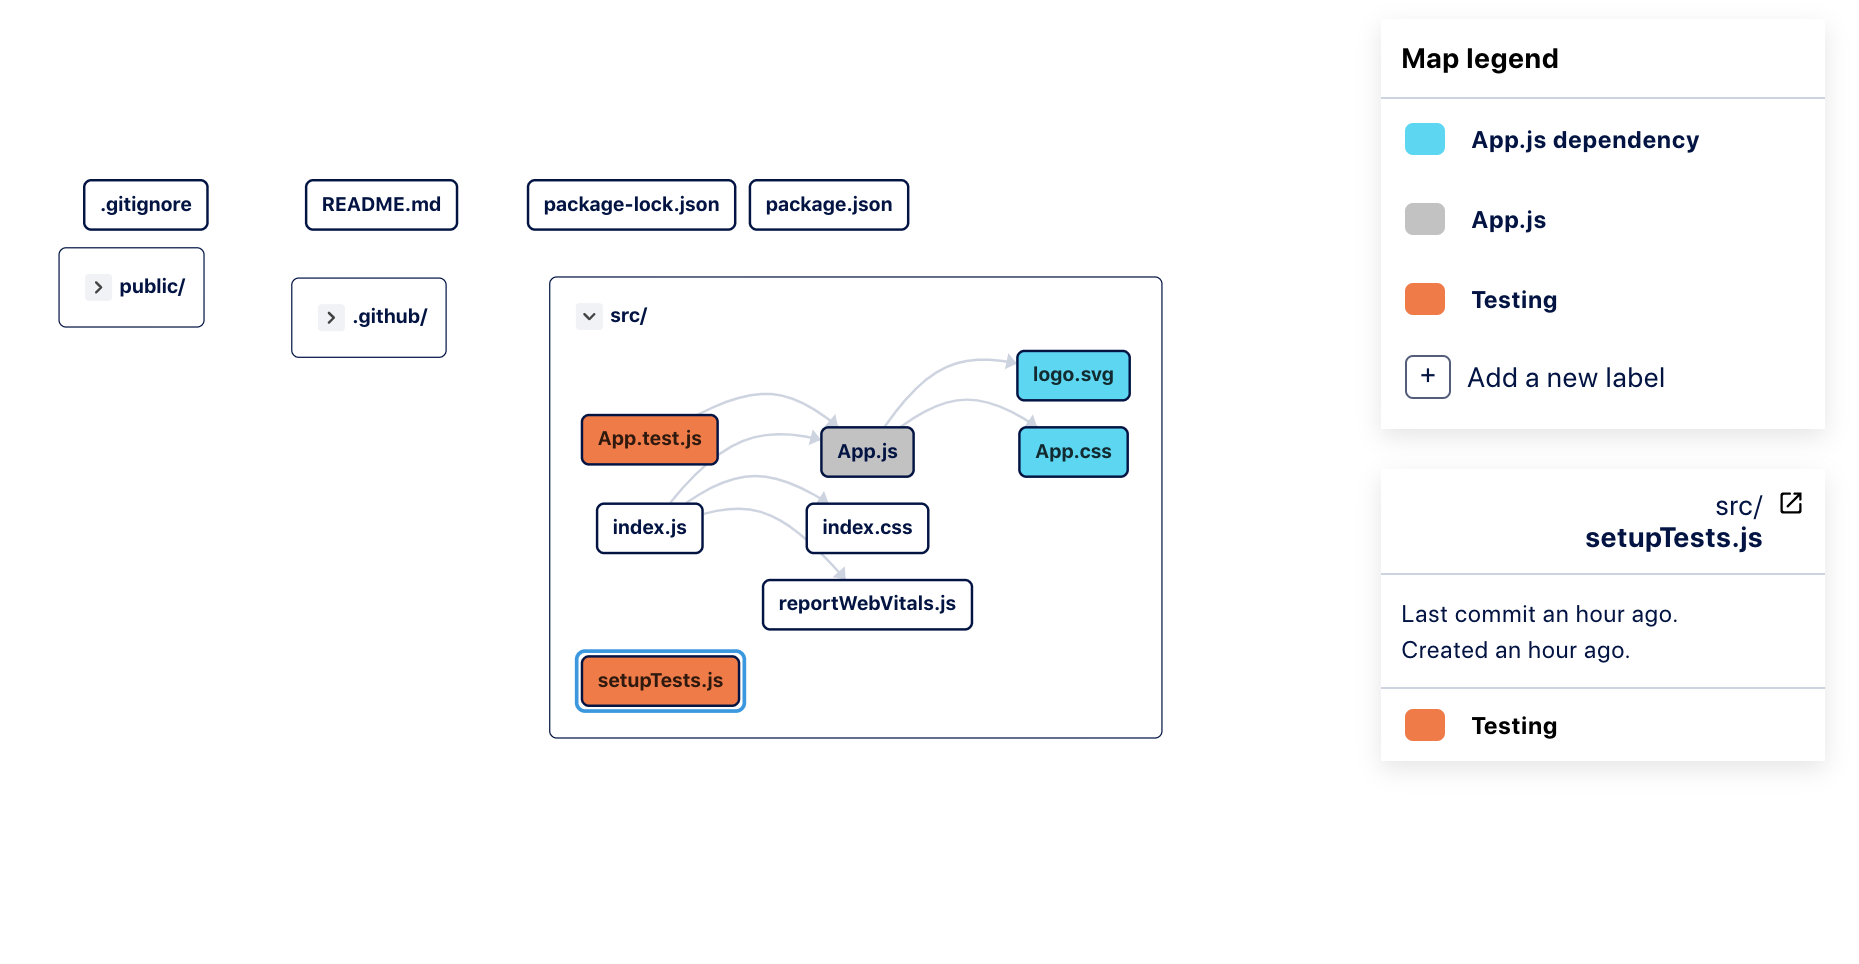
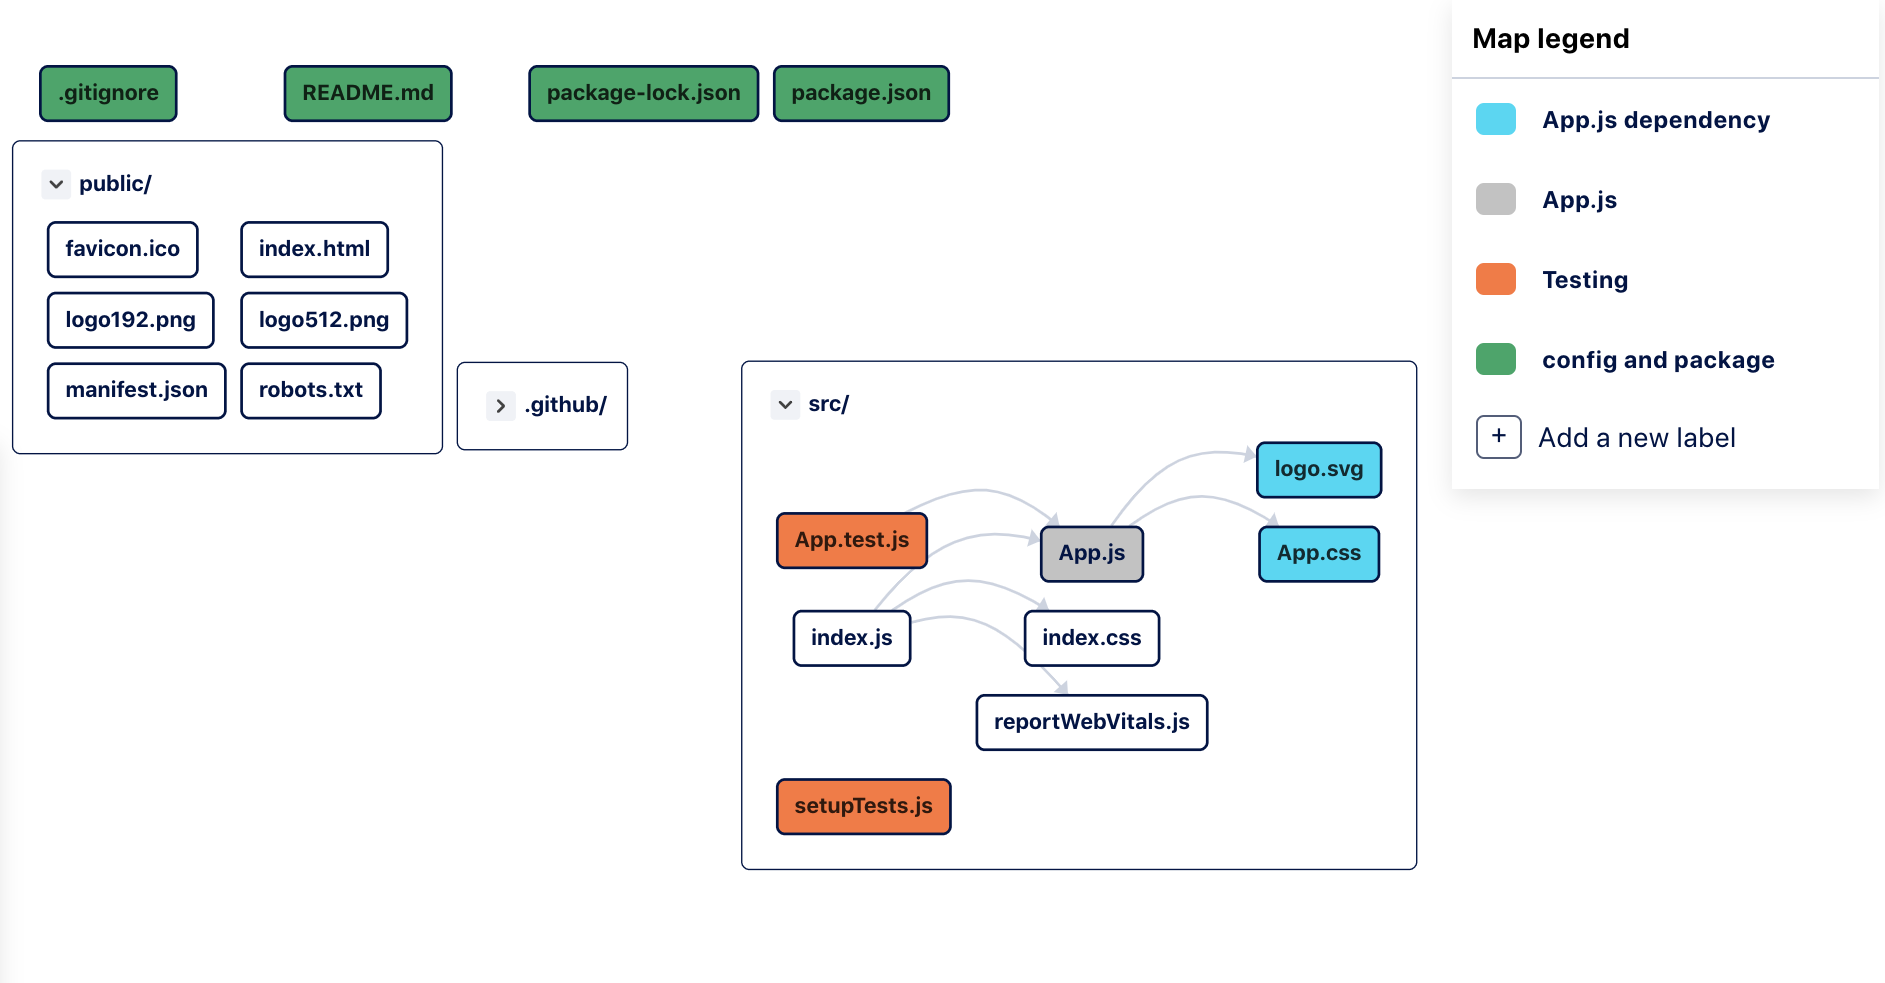
Now, it would be convenient to start color coding my Map. I use the Map legend on the left to create a label for `App.js` imports and add it to them:
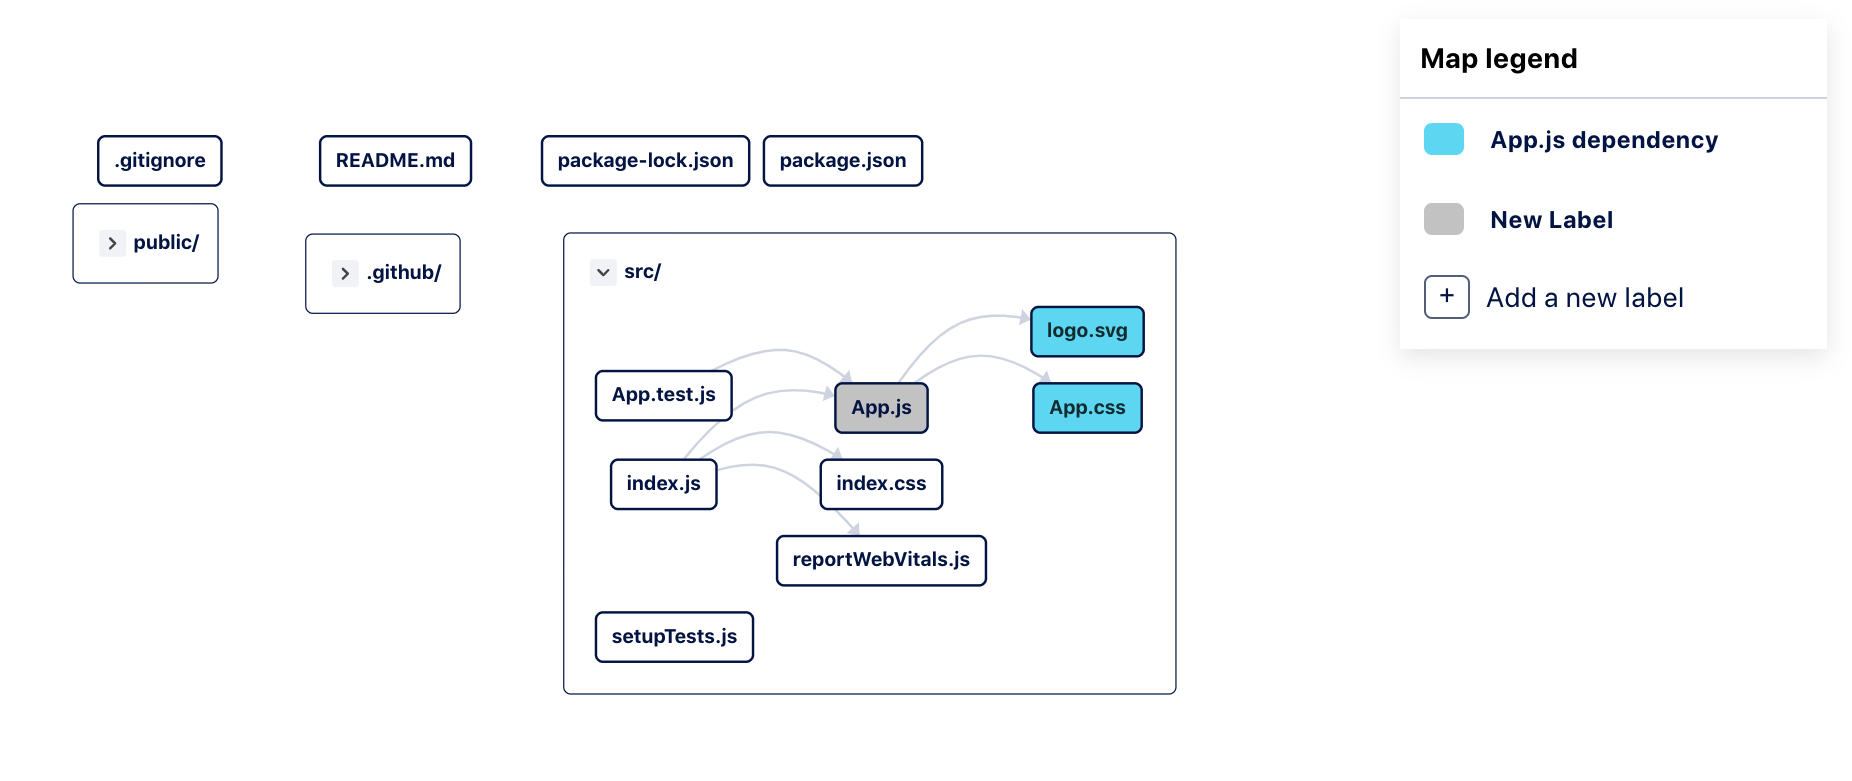
The dependencies are the `logo.svg`, which `App.js` renders, and `App.css`, which holds styles for `App.js`.
3. Where do testing files live?
Using the Map legend, I create another label:
4. Where do configuration and package management files live?
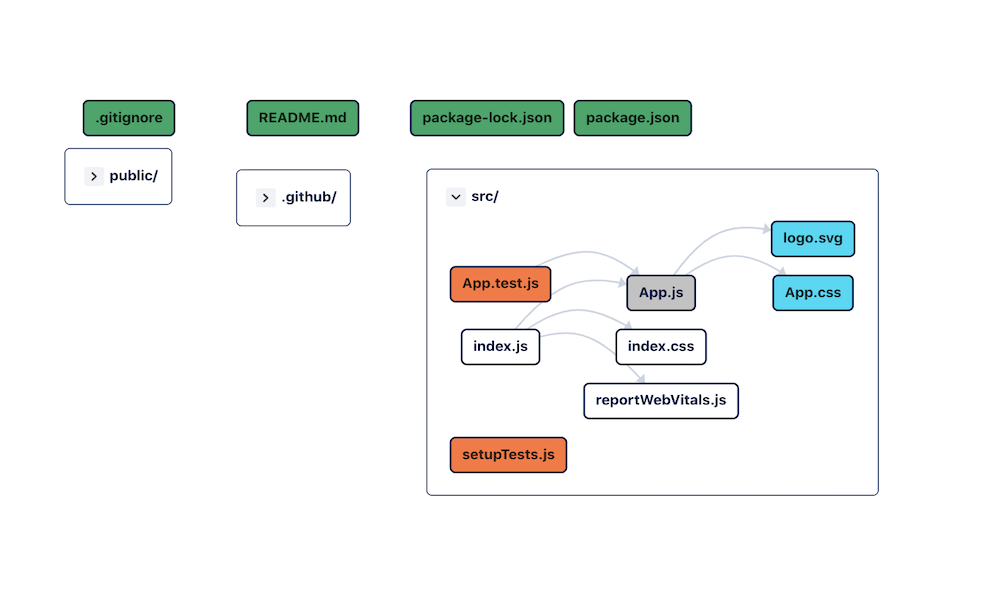
Next, I’d like to know where configuration and package management files are. These are vital for running the project on my machine and replicating it on the machines of others. Conveniently, I see them in a row at the top:
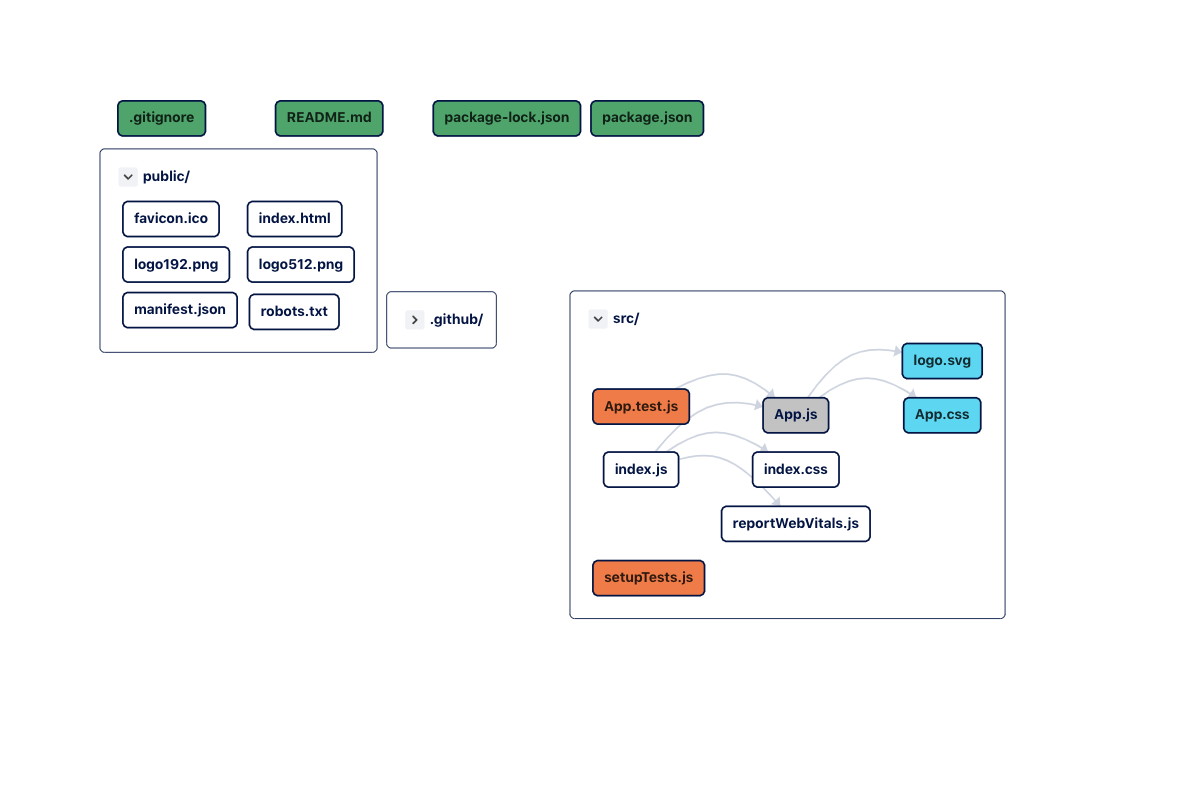
The last folder to look at is `public`. A quick look reveals that it holds the HTML code:
Now I’ve got my codebase mapped and color coded—we’re on the right track to addressing those tickets! To extend testing on the homepage, I could edit the code in `App.test.js`, since we’ve found that this is the main component rendered. Let’s add the link to the Twitter Profile to the `App.js` file itself. Pretty cool right?
Using CodeSee, we were able to make a meaningful contribution to the codebase with confidence.
Use CodeSee to understand your pull requests
Now, let’s say I’ve created a branch to address the testing ticket. I’ve committed some changes, pushed them up, and created a pull request. CodeSee runs a GitHub Action triggered by my pull request to make a Map of the changes I’ve made:
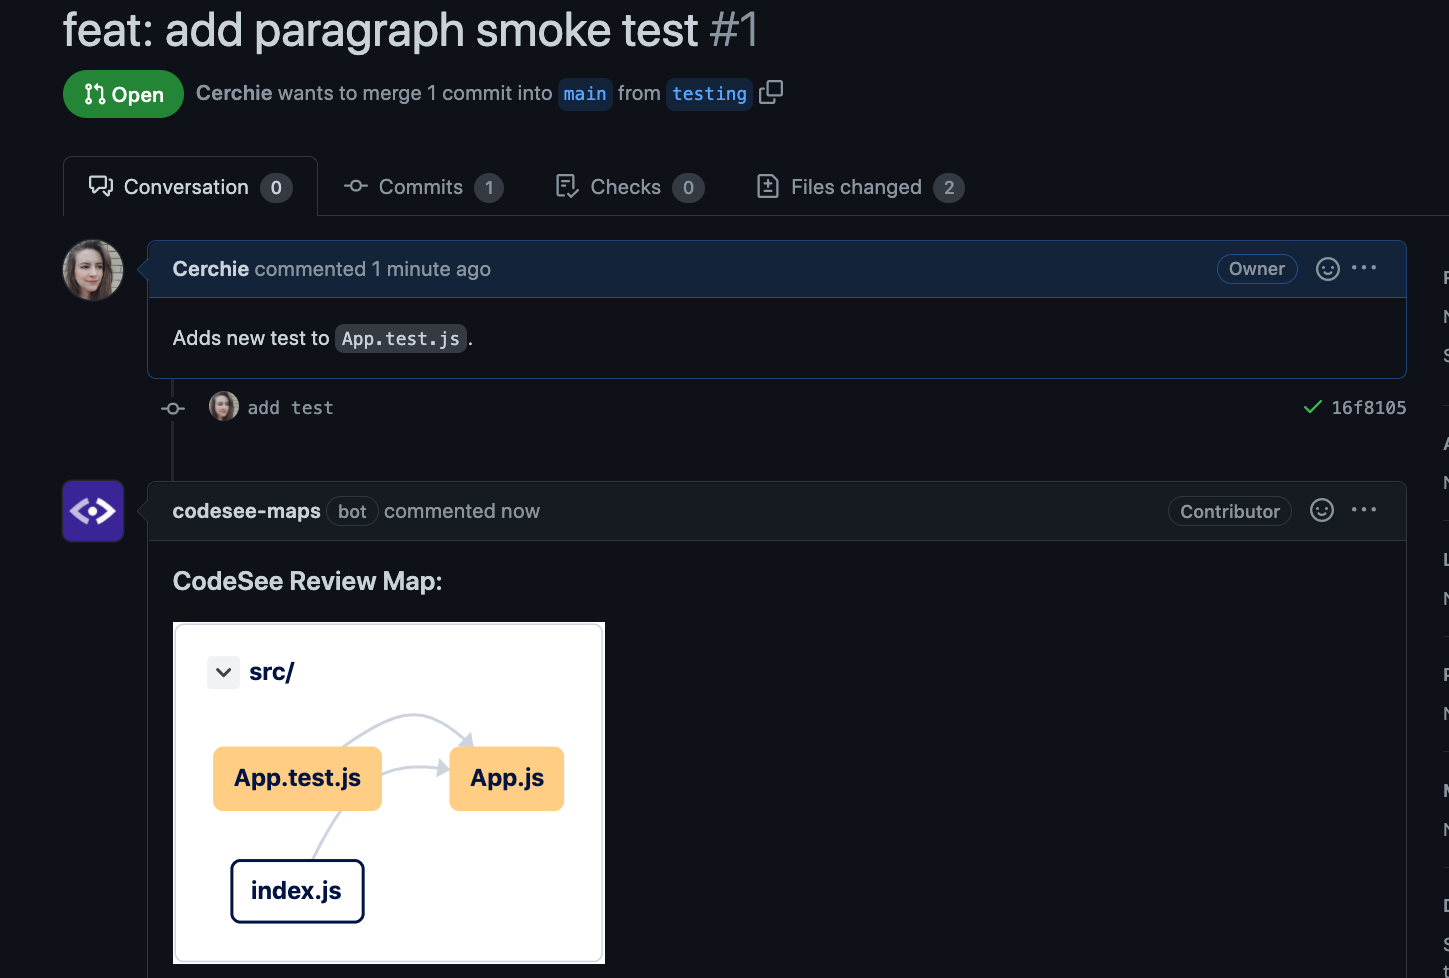
But wait—why do I see changes to `App.js`? I was only addressing needed changes to `App.test.js` in this pull request. I take a look at my branch in my IDE and I see that I’ve left a stray `console.log` statement in my `App.js` file. Now, I can remove it before I request a review on my pull request, saving my reviewer some time.
CodeSee Review Maps can also be helpful for consolidating pull requests. If the convention at your company is to make at least one pull request per ticket, and not one pull request to satisfy many tickets at once, you can use CodeSee to know at a glance whether a pull request has a larger scope than necessary.
Use Codesee to understand historical repository data
Another way you can use CodeSee to get your bearings on a codebase is taking a look at the historical data for a repository. This can help you make improvements out of the gate. I’ve clicked on ‘Auto Insights’ then ‘Engineering Hotspots’ at the bottom left corner of my CodeSee interface.
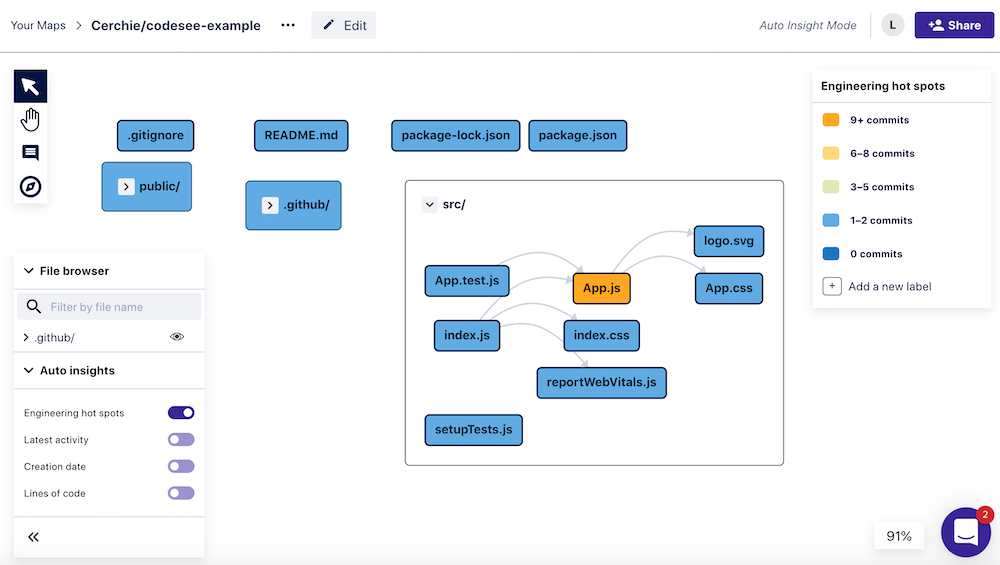
I can immediately see that there’s been a lot of activity in `App.js`, which gives me a clue to what’s required the most work recently. I also see that the `package.json` file has very few commits. In a node project, that could mean that the packages need version updating.
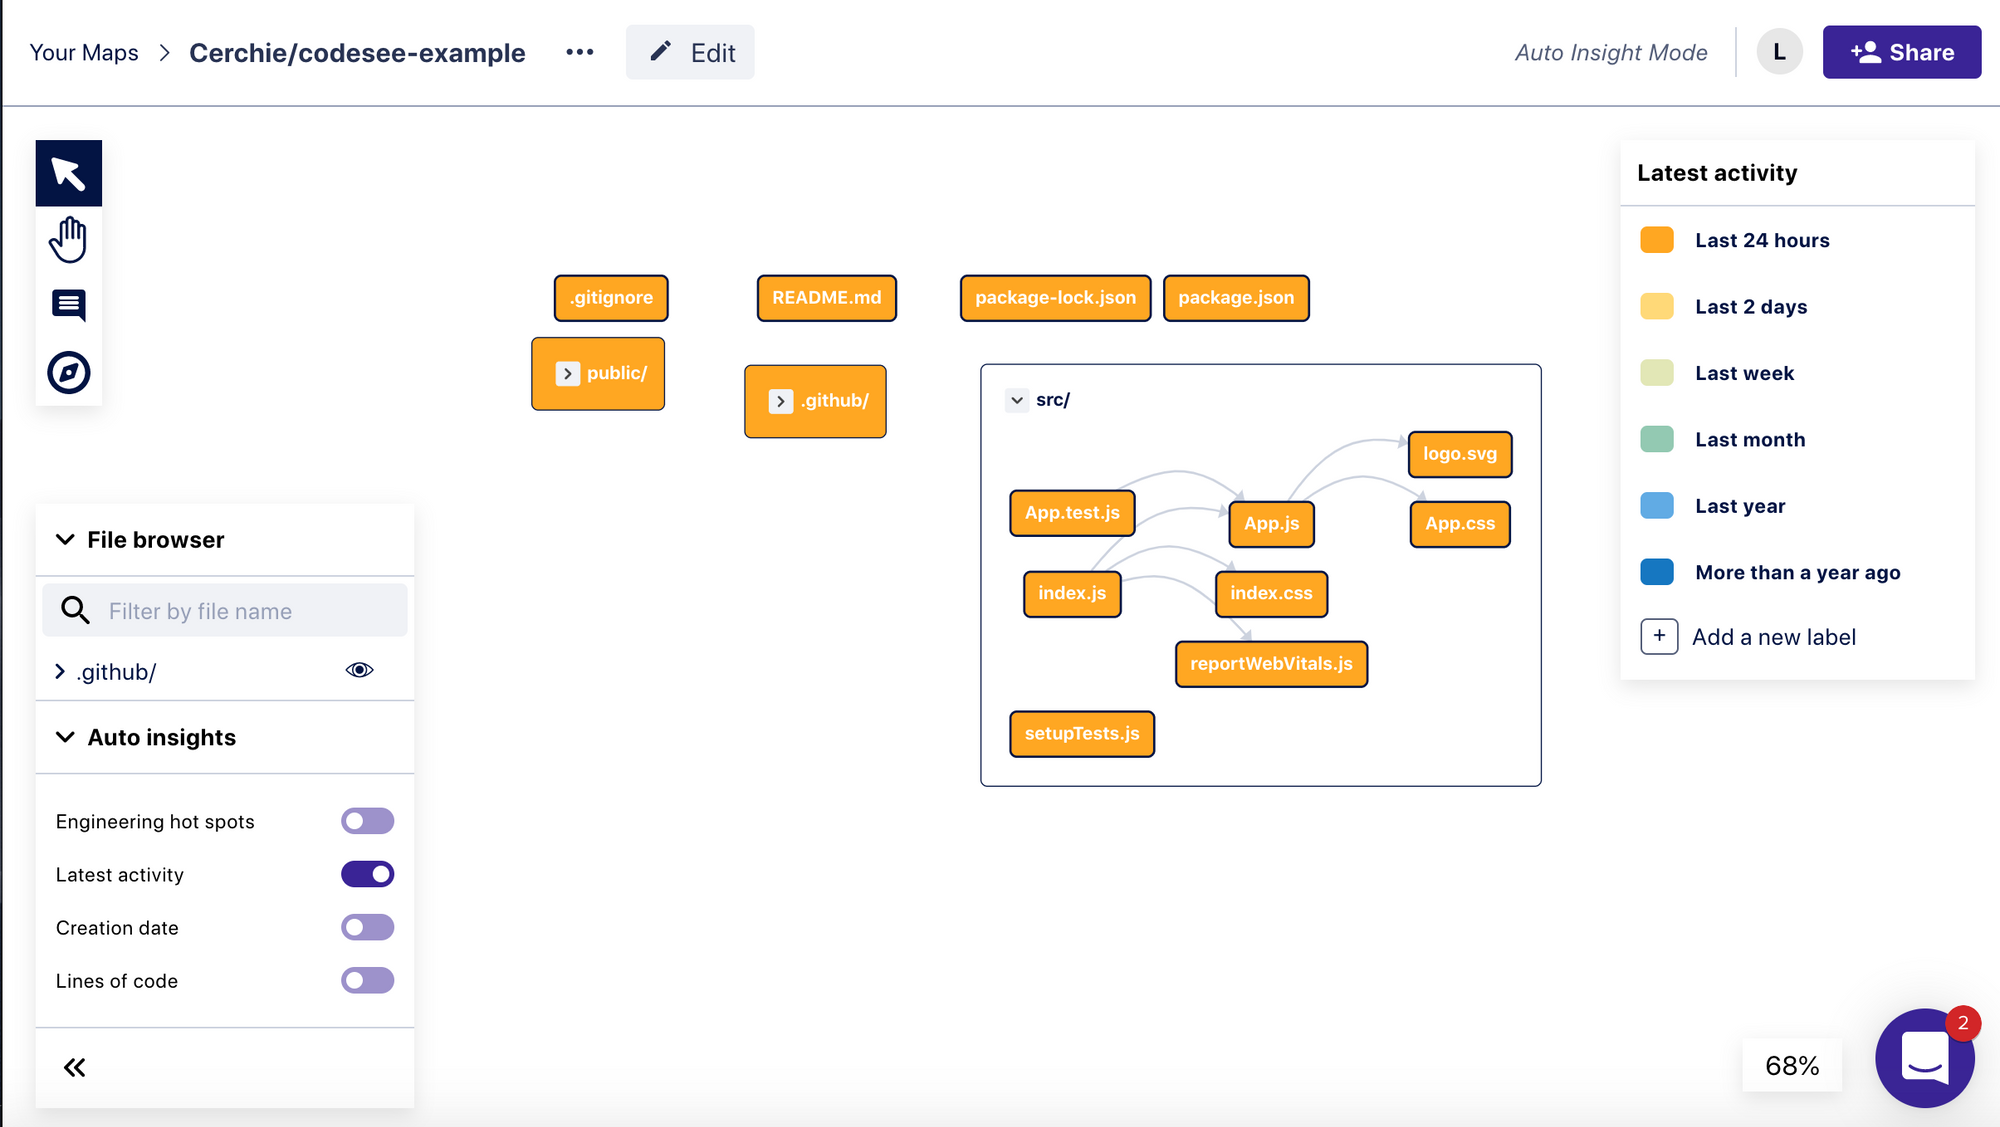
Next, I toggle ‘Latest Activity’. My suspicion is laid to rest—I see that `package.json` has been updated today. At the same time, I write a note to myself to check in with our engineering lead to learn the process for keeping dependencies up to date.
I can also toggle ‘Creation Date’ and ‘Lines of Code’. Creation Date can show me how old the files are, and Lines of Code reveals how many lines are in each file:
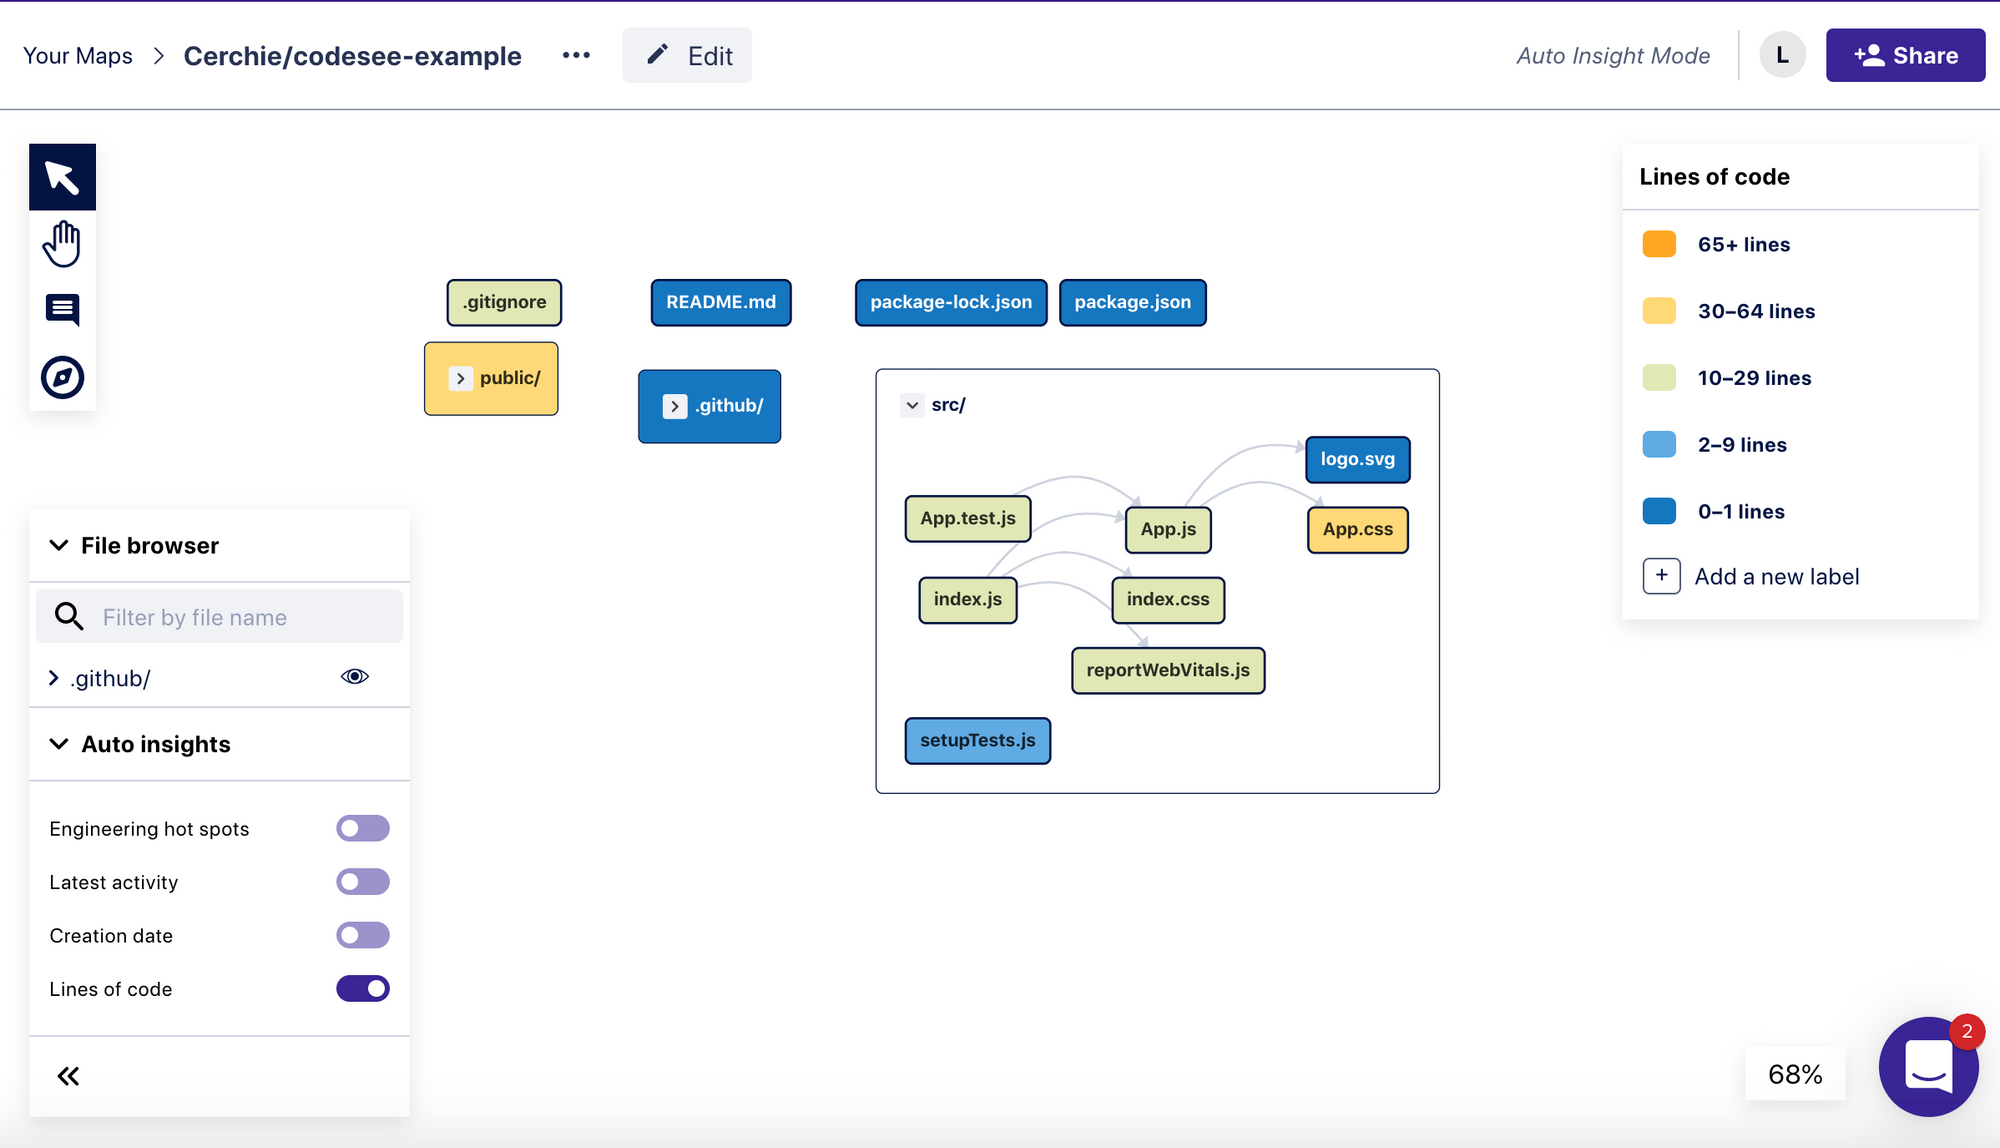
Since this is a new application, each file has under 65 lines of code. That’s pretty compact! But if I saw any files with over 500 to 1000 lines, I might start taking a closer look at these files to look for opportunities to refactor.
Finally, created a code Tour in your Map
Taking inspiration from Edward Tufte, let’s ask, “What do we know, and how do we know it?” First of all, we know which file is key to this codebase: `App.js`. How do we know that? Because we’ve mapped out the dependencies, tests, style files, and indices. We see they all revolve around rendering the component in `App.js`.
Figuring this out has been short work thanks to CodeSee. And we learned several other impactful details about the codebase along the way. We know there’s been activity in `App.js` recently, that every file in the codebase has been updated in the last 24 hours, and that each file holds very few lines of code—all thanks to the Maps Auto Insights panel.
Now, what can we do with our information? As Edward Tufte says:
“And then, finally, the creative thinking eye, it escapes itself and produces and executes, teaches a class, writes an article, makes a visualization, creates an artwork (NPR.org).”
Using our “creative thinking eye” with CodeSee, how do we produce? For one thing, we can make onboarding the next new employee easier by creating a Tour of the code.
I start by clicking the ‘Create Tour’ button on the bottom of the left-hand sidebar. I create a 3-step Tour of the codebase, separating it into the main JavaScript code, HTML, and the packages/configuration. It’s not only helpful to other devs, but requires just a few minutes of additional work to see it come to life.
So, where to go from here?
Interested in giving CodeSee a spin? You can sign up for an account here! Also, don’t forget to check out the docs and CodeSee Learn for more insight into what you can accomplish with CodeSee.