Interested in gaining a deeper understanding of your codebase? It's valuable to know how your code is evolving—especially on a team of contributing devs. The Insights panel in your CodeSee Map provides four key metrics you can visualize to boost your awareness of how your code has changed over time.
In a click, you can toggle between different Insights in the panel. Visualize areas of high activity across a codebase, get details on when files were last updated, and even see how many lines of code make up each file.
Insights are automatically generated when you create a CodeSee Map, and they update with each commit to your main branch—you'll never need to manually update your Insights panel.
Codebase metrics you can visualize using Insights
- Engineering Hot Spots: See which files and folders have had the most recent commits—and which areas of the codebase aren't as active.
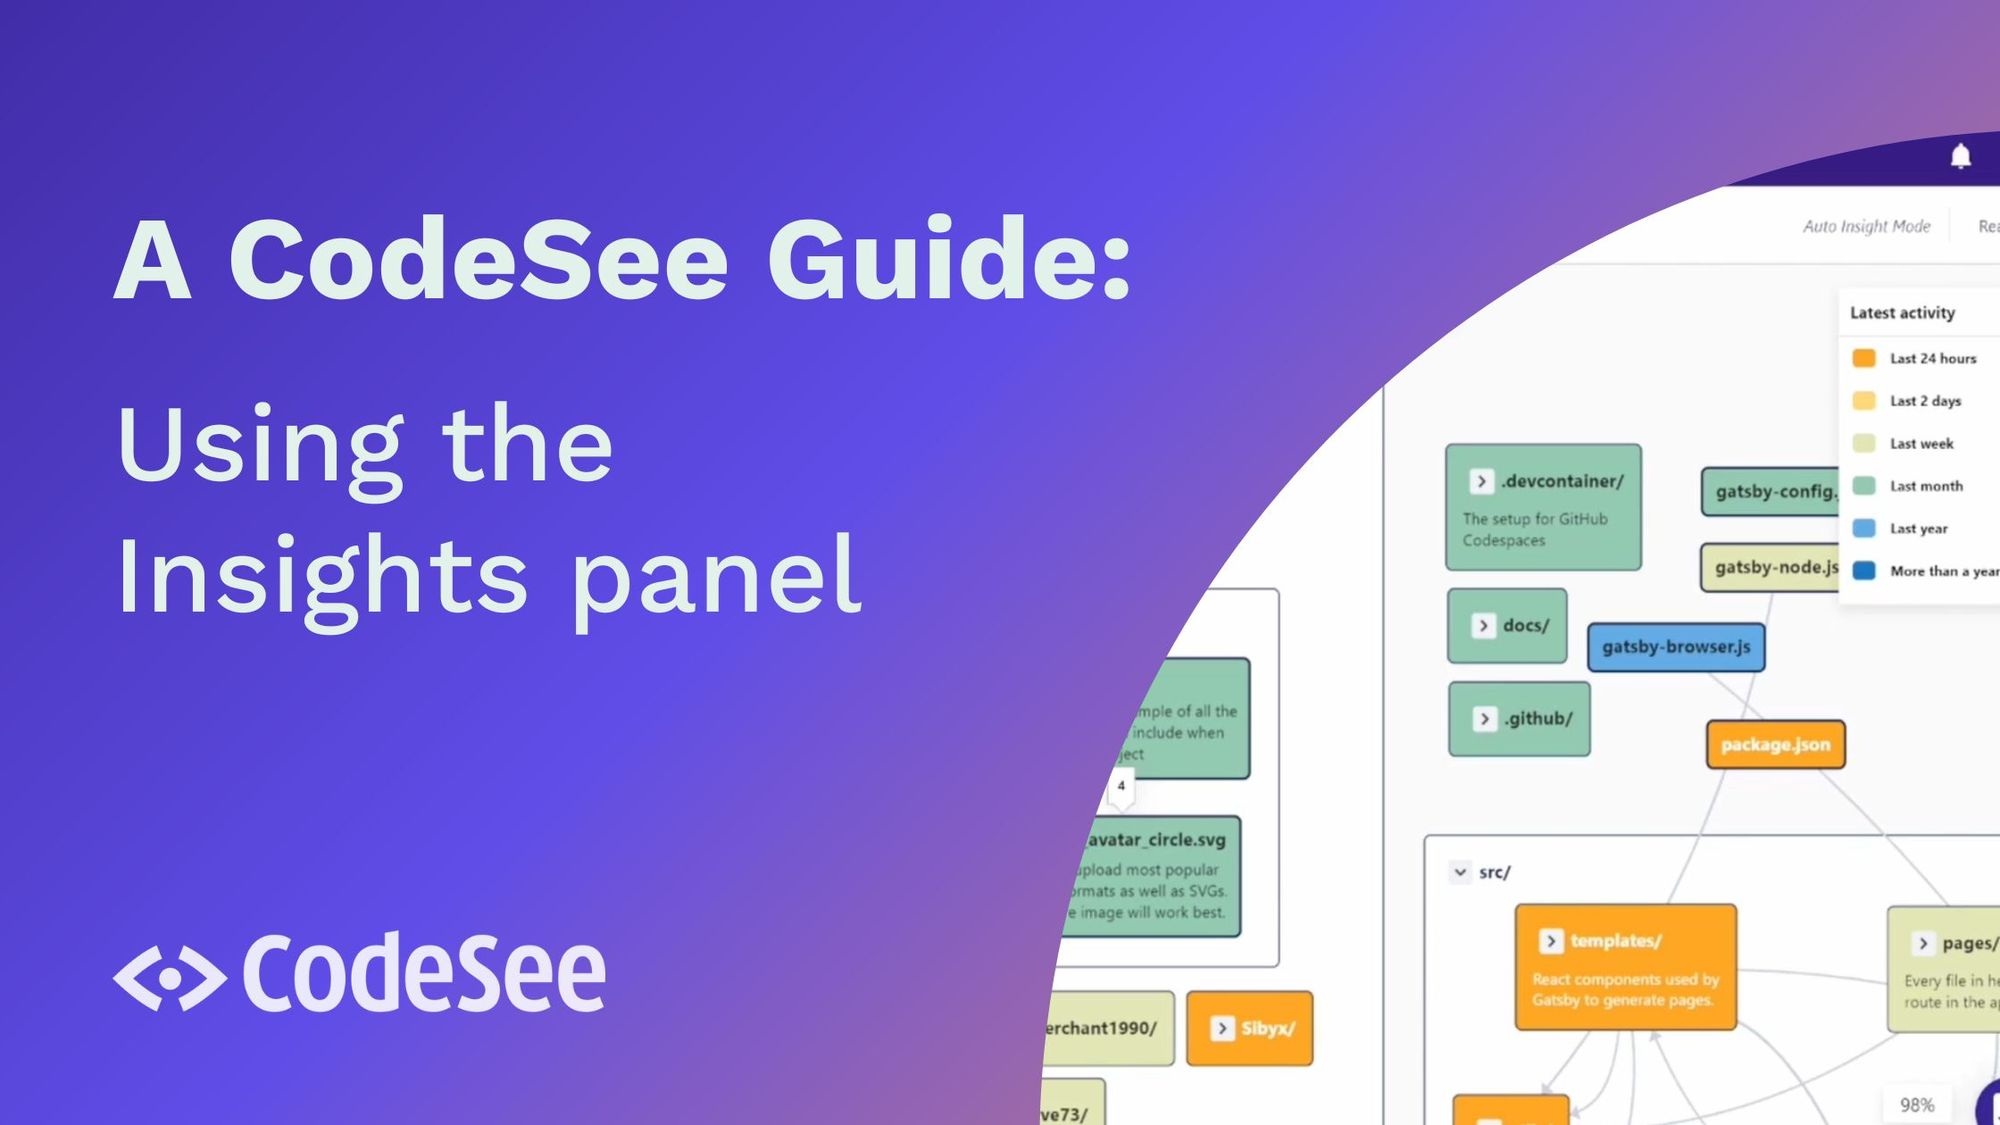
- Latest Activity: See when the last commits to files and folders were made.
- Creation Date: See when files and folders were created in the codebase.
- Lines of Code: See how many lines of code files contain and quickly locate the largest files in your codebase.
Got a couple of minutes? (Or 2 minutes and 16 seconds, to be exact!) In this video, we'll walk you through how to use the Insights panel.